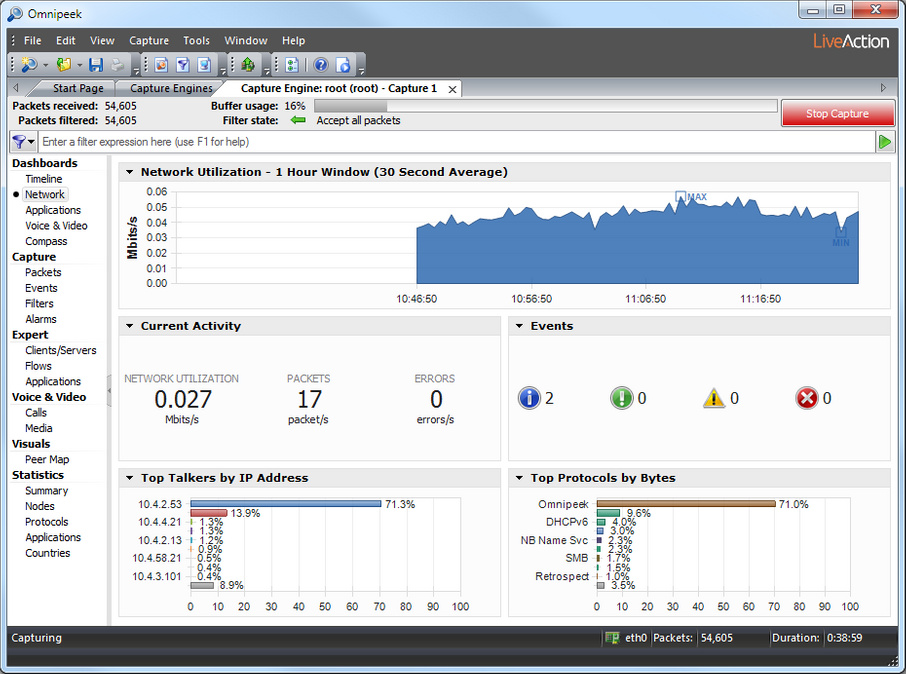
Network dashboard
The Network dashboard displays key statistics for the capture.
NOTE: To have a fully functional Network dashboard that displays data in all of its displays, enable the Network Statistics, Node Statistics, Protocol Statistics, Traffic History Statistics, and Wireless Channel Statistics (for wireless captures) analysis options in the Analysis Options of the Capture Options dialog.
The parts of the Network dashboard are described below.
• Network Utilization: This display graphs network traffic in Mbits/second. You can right-click inside the display to drill-down to selected packets, to select a Column, Skyline, Area, Line, or Line/Points display, or to select an Automatic, Light, Dark, or Clean background theme for the display.
• Wireless Signal: This display graphs wireless signal and/or noise strength (as a percentage) for the wireless channel you are capturing on, or all channels you have configured the capture to scan. This display is available only when a wireless adapter is selected as the capture adapter, or for a wireless capture file. You can right-click inside the display to select the parameters to display. Hovering over a channel will display a tooltip with additional channel information.
• Current Activity: This display shows network utilization (as a percent of capacity), traffic volume (in packets per second), and error rate (total errors per second). You can right-click inside the display to display values as numbers or as gauges, or to select an Automatic, Light, Dark, or Clean background theme for the display.
• Events: This display shows the number of notifications generated by level of severity. You can right-click inside the display to select an Automatic, Light, Dark, or Clean background theme for the display. Clicking a severity icon navigates to the Events view and displays those events corresponding to the severity clicked.
• Top Talkers by IP Address: This display shows a graph of top “talkers” on the network, broken out by node. You can right-click inside the display to display top talkers by Physical Address, IP Address, IPv6 Address, or Country; to select a Bar, Column, Pie or Donut display; to select an Auto Scale or Fixed Scale display; to select to display a Country Name or Country Code; or to select an Automatic, Light, Dark, or Clean background theme for the display. Clicking a bar (or slice) of the graph opens a Detail Statistics window populated with details for the node clicked.
NOTE: This feature is automatically enabled for Capture Engine captures based on the Monitoring Capture template. Top talkers are displayed as Not Available for Capture Engine captures using the Forensic Capture template. See Forensics capture on a Capture Engine and Monitoring capture on a Capture Engine.
• Top Applications: This display shows a graph of top applications on the network. You can right-click inside the display to toggle the display with the Top Protocols display, or to select a Bar, Column, Pie or Donut display. Mouse over a bar (or slice) of the graph to view a tooltip with additional details for the application. Clicking a bar (or slice) of the graph opens a Detail Statistics window populated with details for the application clicked.
• Top Protocols: This display shows a graph of top protocols on the network. You can right-click inside the display to toggle the display with the Top Applications display, or to select a Bar, Column, Pie or Donut display. Mouse over a bar (or slice) of the graph to view a tooltip with additional details for the protocol. Clicking a bar (or slice) of the graph opens a Detail Statistics window populated with details for the protocol clicked.
TIP: Several of the displays inside the Network dashboard support tooltips. Hover over the display to view a tooltip with additional information.
You can also access additional options for viewing each display by clicking the small arrow in the upper left corner of each display, or by right-clicking inside each display.
You can also access additional options for viewing each display by clicking the small arrow in the upper left corner of each display, or by right-clicking inside each display.